Turning industrial safety buffers into AI inference sites
Part 1: Can mandated industrial setbacks ease the AI infrastructure bottleneck?
Chennan Li, PhD, PE — April 2026
5–8 years → 6–18 months at well-chosen sites
Traditional hyperscale path vs behind-the-meter on existing industrial land
Here’s my thinking.
1.1 Data center buildout challenges
Building AI data centers (or AI factories) is getting harder. Long environmental reviews, limited water, multi-year waits for turbines and transformers, community opposition over noise and cooling — and on top of that, heavy capital cost. A newer concern: the first confirmed military attack on hyperscale data centers, in the UAE and Bahrain in March 2026 [16], made it clear that the centralized hyperscaler model also carries a real network-concentration risk. Table 1 summarizes these.
Table 1. The bottlenecks shaping AI infrastructure today
Constraint
Current reality
Timeline impact
Grid interconnection
12,000+ projects queued across US ISOs and utilities
3–7 year wait
Federal/state environmental review (NEPA, CEQA)
Multi-year impact statement (EIS)
2–5 year delay
Water permit
Contested in drought regions
1–3 year delay
Gas turbine (backup power)
Global procurement backlog
18–36 month lead time
Large transformer (100 MVA+)
Manufacturer capacity limits
24–36 month lead time
Community opposition
Noise, visual, cooling footprint
Unpredictable
Capital concentration / attack surface
March 2026: military strike on hyperscale sites in UAE/Bahrain
Structural vulnerability
1.2 Inference is different from training
One thing worth questioning: most discussion treats AI data centers as a single category regardless of workload. But inference, not training, is where most of the industry now expects the growth to concentrate — Jensen Huang puts it at roughly 80% inference vs 20% training [17], a view Andrew Feldman echoes from the Cerebras side [18].
The implication for infrastructure is important. A single NVIDIA Vera Rubin NVL72 rack holds 20.7 TB of HBM4 [2] — enough to host a GPT-4-class model in memory on one rack. Cerebras CS-3 reaches a similar outcome through a wafer-scale architecture with 21 PB/s on-chip memory bandwidth [12]. If those numbers hold, inference does not need the same scale of infrastructure as training: a four-rack modular AI factory could illustratively host frontier models with redundancy at 500 kW to 20 MW. More importantly, such factories can be sited close to the users rather than concentrated in a handful of hyperscale campuses.
Table 2. Illustrative serving tiers for inference-oriented AI factories
Size tier
Racks
HBM4 total
IT power
Illustrative serving envelope
Small
1–2
20–40 TB
0.2–0.4 MW
Single frontier model such as GPT-4 or Claude 3 Opus-class (~1–2T params); serves ~10K–100K users (small city, industrial park). 2 racks give N+1 headroom.
Medium
4–6
80–125 TB
0.8–1.1 MW
Current frontier models (GPT-5, Claude 4, Llama 4 405B) with multiple concurrent instances; serves ~100K–500K users (a mid-sized city).
Large
9–25
185–515 TB
1.7–4.8 MW
Multiple models running in parallel (GPT-5 + Claude 4 + DeepSeek R1), including reasoning models with long context; serves ~500K–2M users (a large metro).
XL
33–74
680 TB – 1.5 PB
6–14 MW
Next-generation models (10T+ parameters) at hyperscaler-class throughput; serves 2M+ users (a major metro area such as Chicago, Houston, or a multi-city region).
Cells are illustrative — real serving capacity depends on workload and utilization. All based on NVIDIA Vera Rubin NVL72 at 190 kW / 20.7 TB HBM4 per rack [2, 3]. Cerebras CS-3 offers an alternative architecture at ~23–30 kW per system with 44 GB on-chip SRAM plus optional MemoryX for larger models [12]. Cerebras has demonstrated Llama 3.1 405B and DeepSeek R1 in production.
1.3 Behind-the-meter AI factories inside industrial plants
Sections 1.1 and 1.2 together point to a practical siting question: why not co-locate these AI factories inside an existing industrial plant, operating behind the meter?
Most industrial plants already have what a modular AI factory needs — water for cooling, an established electrical service sized for peak operations, 24/7 staff, and physical security. The AI factory at any given site is sized bottom-up to what the host can actually support: electrical capacity left in the existing service, water available for cooling, regulated buffer land that can host solar PV and battery storage, and local inference demand the site is well-positioned to serve. Different host plants will therefore end up with very different factory sizes, rather than a target capacity chosen in advance the way a typical greenfield data center is sized. Within those site limits, the colocated AI center manages its own energy and traffic: buffer-zone PV plus a 4-hour BESS shave daily peaks and cover short on-site shortfalls, while any overflow the local envelope cannot serve is routed to a hyperscaler API — local racks keep serving steady-state demand at low latency and the overflow portion accepts the longer round-trip in exchange for guaranteed capacity.
Because the AI factory sits behind the plant’s existing meter as load-side equipment, it can be curtailed any time the host needs the electrical service back. If a specific site does need more grid capacity than the existing service provides, that is a case-by-case distribution-level upgrade — a larger service transformer or a second feeder dedicated to the AI load [13] — which is routine distribution work, not a new high-voltage transmission interconnection (which runs 3 to 7 years), and can be scheduled into one of the plant’s existing maintenance windows.
For example, a typical 30 MGD municipal wastewater treatment plant (WWTP) draws roughly 1.8–2.5 MW on average, with a daily peak near 2.5–3.2 MW [19]. The existing utility service feeding it is usually a 4–6 MW interconnection at 12 to 34.5 kV, sized to cover storm-flow peaks and motor inrush with a comfortable margin — which means most of the time a meaningful slice of that service capacity sits unused. That normally-idle headroom is what a behind-the-meter AI factory is sized to absorb. At sites with similar service sizing, a 1–2 MW AI factory would typically fit inside that margin during normal operations; this has to be verified site by site with the utility.
Put together, this pattern flips several items in Table 1 — no new grid interconnection, no new land acquisition, no new water permit, no standalone transformer procurement, fewer residential neighbors to object to, and a distributed footprint in place of a single concentrated attack surface. The approval pathway runs months to low-single-digit years instead of the 5–8 years typical for greenfield hyperscale, because what’s being added is a commercial distribution service, not a new transmission interconnection. That’s regulatorily routine, though still subject to host sign-off and, for municipal or corporate sites, a ground-lease approval.
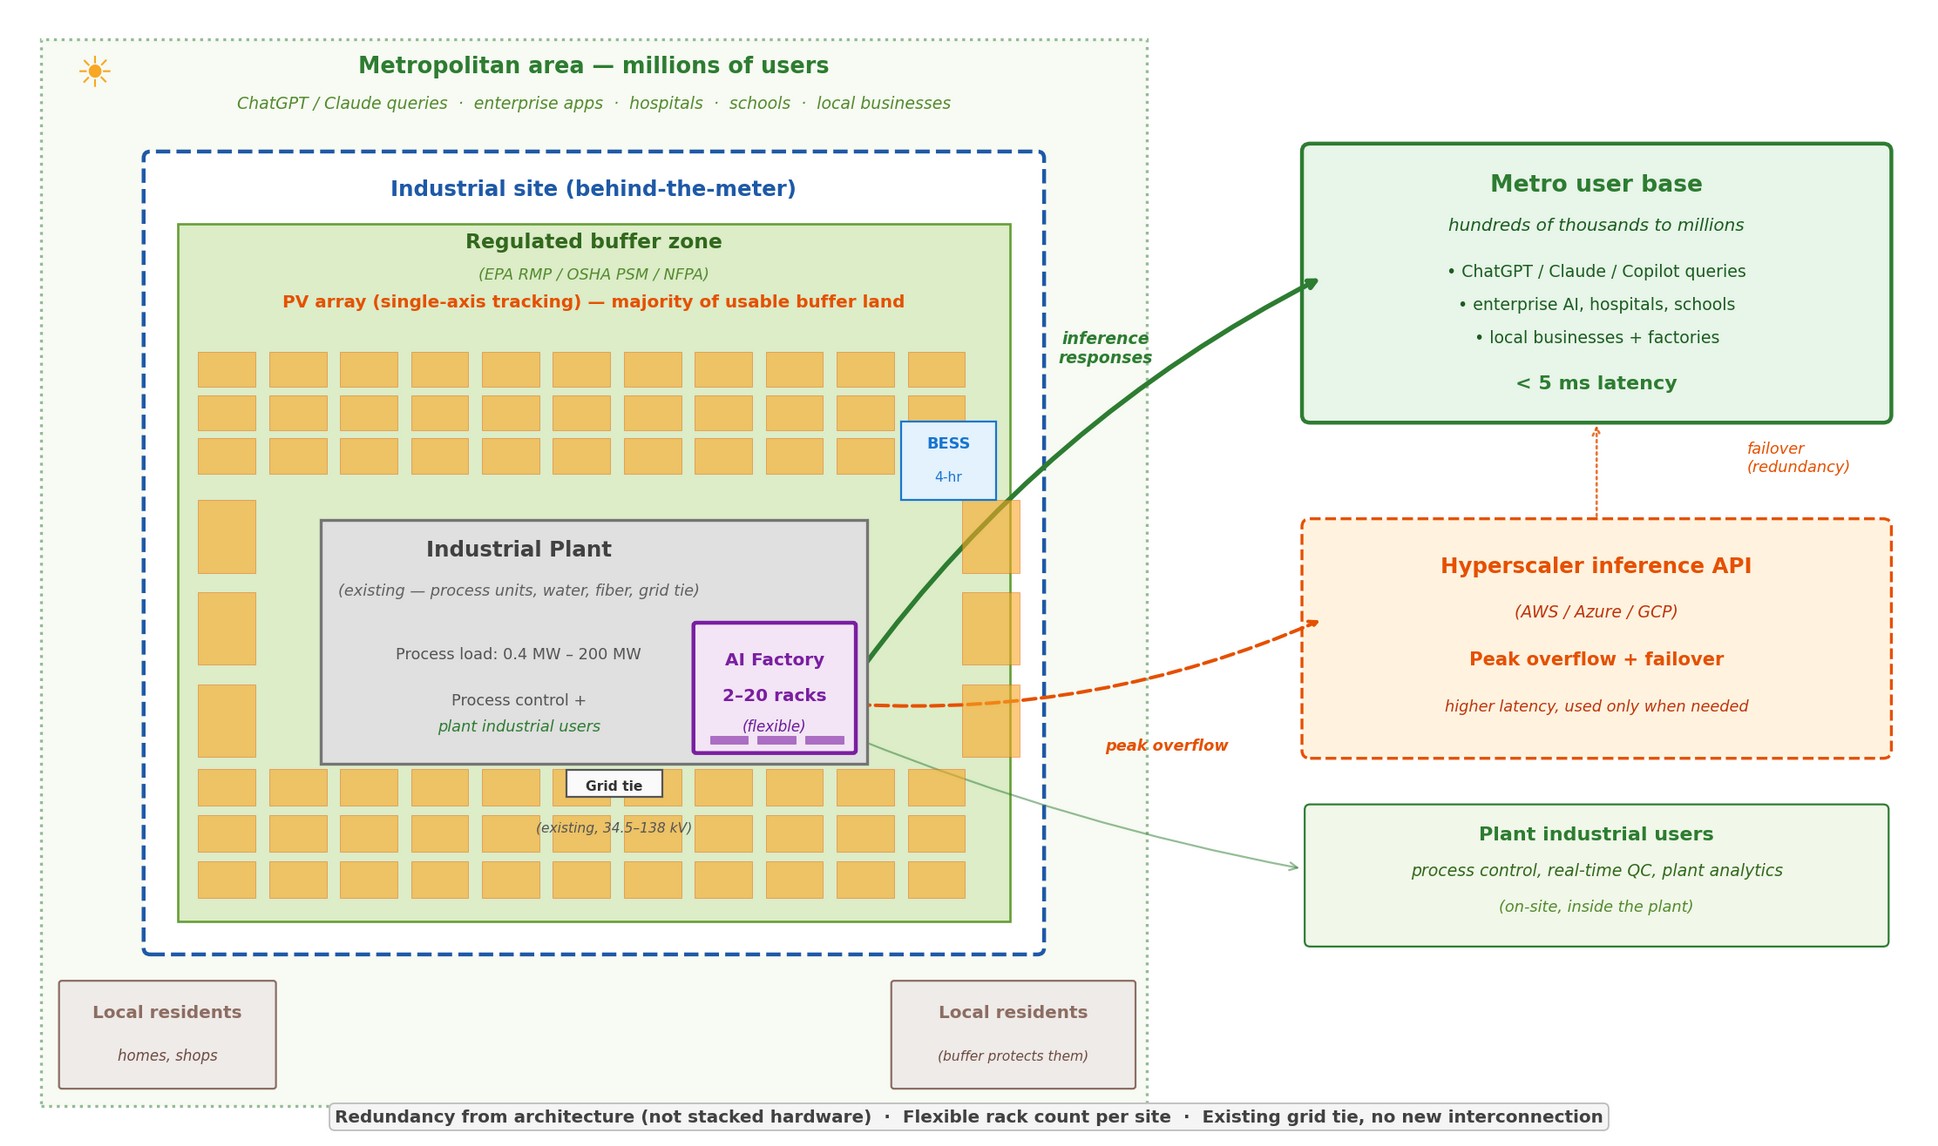
Figure 1. Distributed AI inference architecture on an industrial buffer zone
Industrial plant sits in the center of the site (grey, existing); the AI factory occupies a small corner adjacent to the plant. The regulated safety buffer zone surrounds the plant and hosts the PV array (most of the buffer) plus a small 4-hour BESS. Local residents live outside the buffer. The AI factory serves metropolitan-area users — hundreds of thousands to millions of people within ~20 km — at low latency. Peak traffic and failover route to a hyperscaler API. (click image to enlarge)
1.4 Checking the numbers
An idea needs numbers to back it up. The following is a set of order-of-magnitude estimates across eight typical industrial site categories; the next blog will work through one of them in full engineering detail. Each type carries its own mandatory land requirements and federal safety setbacks (EPA’s Risk Management Program, OSHA’s Process Safety Management, NFPA fire-protection codes). For a typical WWTP these take roughly 10–20% of the regulated area; for a large petrochemical complex, closer to 40–50%. Only the remaining usable area is counted for PV. Rack counts assume Vera Rubin NVL72 at 190 kW per rack [3]. Results are in Table 3 and Figure 2.
Table 3. Industrial site types: US counts and infrastructure readiness
All estimates assume single-axis tracking PV and Vera Rubin NVL72 at 190 kW per rack [3]. AI factory sized to match annual PV generation for PV-matched sites; small chemical plant relies primarily on grid headroom with PV as supplement. Workload tiers refer to Table 2. Bracketed numbers [N] reference the Sources list at the end.
Site type
US count
Total regulated area
Usable buffer
PV capacity
Racks
Grid voltage
Fiber availability
Suitable workload tier
Small–medium specialty chemical
~1,200 [1,4]
3–18 ha
1.5–9 ha
1.2–6 MW
4–6
34.5–69 kV
Usually good (industrial parks)
Medium: ~100K–500K users
Large petrochemical complex
~80 [5]
~500 ha
~150 ha
~100 MW
~74
110–220 kV
Excellent
XL: 2M+ users
Pharmaceutical API plant
~200 [6]
~20 ha
~10 ha
~6.7 MW
6
34.5–69 kV
Excellent (biotech clusters)
Medium: ~100K–500K users
Ammonia / fertilizer plant
~30 [7]
~30 ha
~15 ha
~10 MW
9
69 kV
Limited (rural)
Large: ~500K–2M users
Food processing (NH3 refrig.)
~1,500 [8]
~6 ha
~3 ha
~2 MW
2
34.5 kV
Mixed (rural poor / suburban OK)
Small: ~10K–100K users
Large refrigerated cold storage
~1,000 [9]
~4 ha
~2 ha
~1.5 MW
1–2
12–34.5 kV
Good (logistics hubs)
Small: ~10K–100K users
WWTP — mid-to-large (10–1,000 MGD)
~1,500 [10]
10–150 ha
5–67 ha
3–45 MW
2–25
34.5–138 kV
Excellent (always urban)
Small to Large; up to a major metro
LNG terminal
~170 [11]
~150 ha
~60 ha
~40 MW
33
69–138 kV
Variable (coastal)
XL: 2M+ users
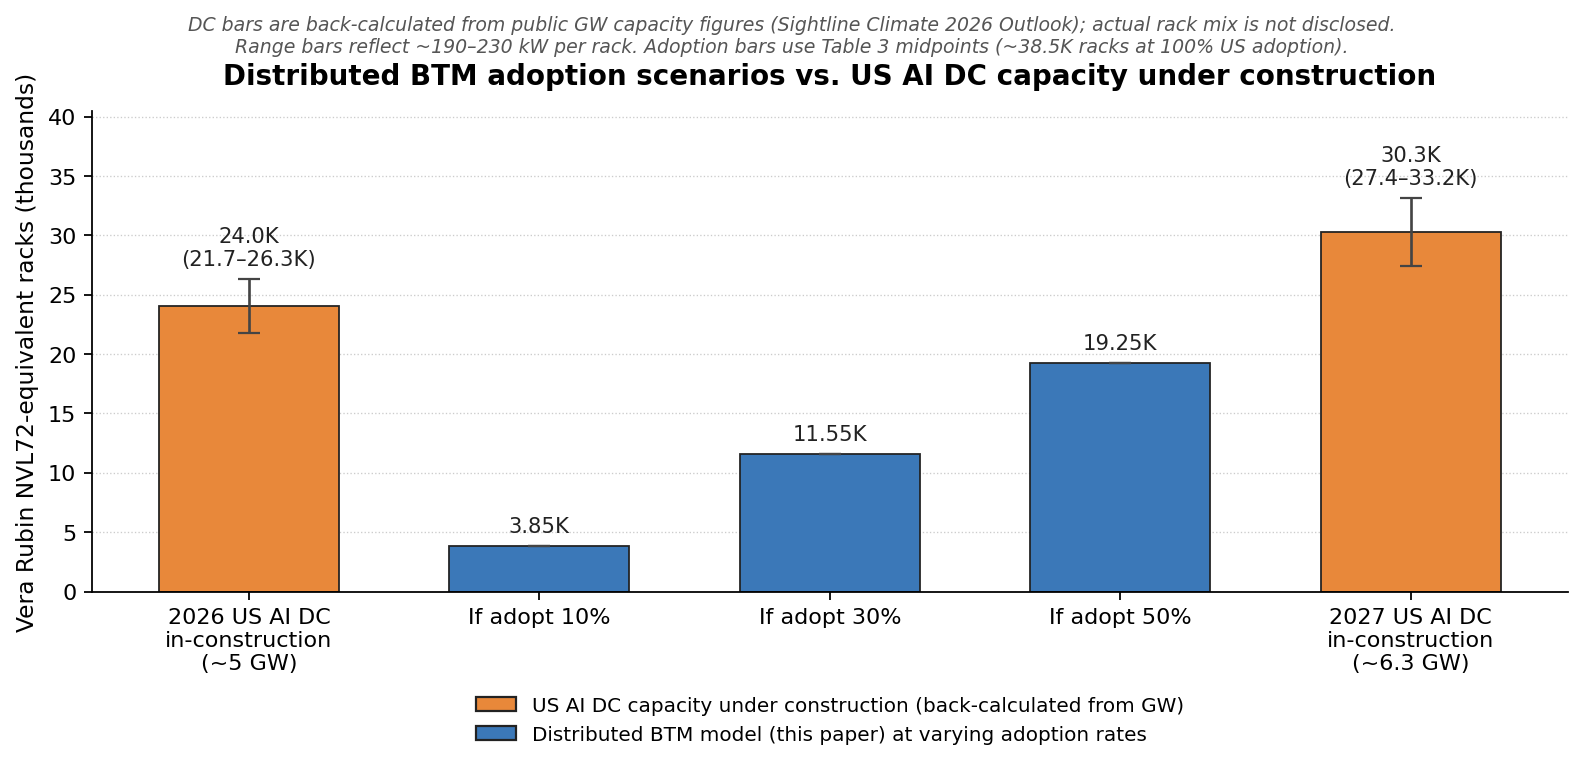
For context on how this compares to the conventional build-out: the reported US AI data center pipeline is often quoted in the tens of gigawatts, but actual in-construction capacity is much smaller — roughly 5 GW in 2026 and 6.3 GW in 2027 per Sightline Climate’s 2026 Data Center Outlook [14]. The gap between “announced” and “actually being built” is the bottleneck stack in Table 1. The distributed behind-the-meter model sidesteps most of that stack — existing substations, existing safety buffer land, no new environmental review — so the question is simply how much of the Table 3 opportunity actually gets built. Figure 2 places three adoption scenarios (10%, 30%, 50% of the ~38,500-rack total) against what is physically under construction today.
Figure 2. Distributed BTM adoption scenarios vs. US AI DC capacity under construction
The 2026 and 2027 bars are back-calculated from Sightline Climate’s public GW figures (~5 GW and ~6.3 GW US in-construction) [14] assuming ~190–230 kW per rack — actual rack composition of those facilities is not disclosed. The three middle bars show the distributed BTM model at 10%, 30%, and 50% adoption across the eight Table 3 site categories (Table 3 midpoint total: ~38,500 racks at 100% US adoption). At 30% adoption the distributed model is ~48% of what is actually being built for 2026 and ~38% for 2027; at 50% adoption it exceeds 2026 in-construction capacity and reaches ~64% of 2027. The comparison is against in-construction capacity specifically, not announced pipeline. (click image to enlarge)
This model is also consistent with Cerebras’s own deployment pattern — their facilities range from 2.5 MW (Stockton, CA) to a planned 100 MW in Guyana co-located with a gas-to-energy plant, rather than gigawatt campuses [12]. The distributed, modular, co-located approach is already being validated at scale by inference-focused AI hardware vendors.
Notes on each site type
Pharmaceutical API manufacturing. Synthesis-side plants cluster in a handful of biotech corridors along the Northeast, around Boston, in the Research Triangle, and in the Midwest — all metro areas where fiber and grid service are generally adequate. Formulation-only plants carry much smaller solvent inventories and setbacks, so they are not the target subset.
Municipal wastewater treatment plants. Every US city has one, and because they sit in urban or suburban areas the fiber and grid basics are usually adequate. The binding constraint is municipal ownership: any buffer-zone ground lease goes through city council approval and often a competitive RFP, which adds months to an otherwise quick timeline. The flip side of that same public-sector structure is where the economics look most socially useful — WWTPs run on ratepayer fees plus periodic federal and state grants (EPA Clean Water State Revolving Fund and similar), so a ground-lease or revenue-share stream from an AI factory can directly offset capital improvements the utility would otherwise fund through rate hikes or competitive grant cycles.
Food processing. Large meatpacking plants are typically rural, close to livestock and far from metro fiber; grid service is usually adequate for their refrigeration load, but high-bandwidth fiber can be a multi-month to over-a-year new build. Dairy and cold-storage facilities are often closer to population centers, where fiber is less of a gap.
Ammonia and fertilizer plants. These have large per-site buffers but cluster near cheap natural gas, which in practice means the Gulf Coast and parts of the agricultural Midwest. Rural fiber tends to be the binding constraint.
LNG terminals. Coastal by definition, with some in genuinely remote locations. Gulf Coast terminals tend to benefit from the petrochemical corridor’s fiber backbone; other sites vary considerably and need to be evaluated individually.
Large petrochemical complexes. These are the strongest on technical criteria — dedicated 110–220 kV substations, extensive internal and external fiber — but the binding constraint is political rather than technical. Any buffer-zone change at a high-value operating asset goes through an extensive process-safety review (HAZOP), and EHS organizations at these sites are extremely conservative about non-process uses of regulated land.
1.5 Economics: different value, not necessarily more expensive
A precise cost per million tokens on the distributed model requires a site-specific study; too many variables interact in ways that only become clear once one concrete site is worked through. The next blog does that for one WWTP case. For now, Table 4 summarizes the main dimensions of comparison.
Table 4. Hyperscale GW-scale vs. Distributed BTM
Dimension
Hyperscale GW-scale
Distributed BTM
Deployment scale
500 MW – 5 GW per campus
1–20 MW per site typical; 30–50 MW at the largest grid-extended industrial sites; thousands of sites in aggregate
Approval & build timeline
Often 5–8 years greenfield (grid interconnection + permitting)
Potentially months to low-single-digit years at selected sites, subject to host approvals
Electricity cost
$0.04–$0.06/kWh via 20-yr renewable PPA
$0.05–$0.09/kWh blended PV+BESS+grid backup [15]
Infrastructure refresh cycle
Long-lived utility infrastructure with periodic GPU refresh
One PV+BESS buildout supports 4–6 GPU generations (rack swap only)
Distributed across every US metro with industrial footprint
Hyperscale electricity bound from public PPA disclosures by large hyperscalers. Distributed BTM blended rate from utility-scale PV+4-hr BESS LCOE [15] with a 20–40% uplift for behind-the-meter scale and partial night grid draw; large grid-extended sites can land near the lower end of the band. Refresh cycle follows from infrastructure asset lives: PV 25–30 yr, BESS 10–15 yr, AI hardware 3–5 yr.
On cost, distributed BTM electricity lands within roughly twenty to thirty percent of hyperscale — more expensive than a top-tier 20-year renewable PPA of the kind the largest hyperscalers can lock in, but broadly comparable to smaller hyperscale operators who pay closer to industrial rates.
On market size, distributed sites do not need to handle training, so they are a natural fit for inference-specialized hardware (Cerebras, Etched, and similar). At fifteen percent adoption the distributed accelerator market is roughly $17 billion in the first wave and rises toward $70–90 billion cumulative over a twenty-year site life with multiple GPU refresh cycles.
For an AI infrastructure buildout widely described as “the largest in history,” a model that can contribute roughly fifteen percent of near-term in-construction capacity on a renewable-primary, geographically distributed basis, at cost broadly comparable to hyperscale, and on a timeline measured in months rather than years, seems worth investigating in more detail. The next blog works the numbers through for one concrete site to test whether this framing holds up under actual engineering constraints.
1.6 Scope
This blog focuses on one specific opportunity class: behind-the-meter AI inference factories sited inside existing industrial safety buffer zones — typically 1–20 MW per host, up to 30–50 MW at the largest petrochemical complexes. It complements rather than replaces hyperscale training campuses, and it is distinct from the retired-power-plant repower trend running at 50–200 MW per site. Table 5 draws the line.
Table 5. Scope of this blog vs. adjacent opportunity classes
Dimension
In scope (this blog)
Out of scope (different class)
Size per site
1–20 MW typical; 30–50 MW possible at large petrochemical complexes with significant substation headroom
50–200 MW (retired power plants); 500 MW+ (hyperscale campus)
Electrical connection
Existing 12–138 kV distribution service, behind the meter
Transferable ISO interconnection agreements at 115–345 kV transmission
Retired coal/gas plant footprint; greenfield permitted for DC
Primary workload
Inference-dominant, local metro serving
Training-dominant, cross-region orchestration
Hardware stack
Modular, multi-vendor, frequent GPU refresh
Hyperscale-grade unified stacks
Exemplar hosts
WWTPs, petrochemical, pharma API, LNG, fertilizer
Retired coal/gas plant footprints; merchant DC developers on ISO-scale sites
Operator profile
Industrial operator + AI infra partner on ground lease
Merchant DC developer + ISO-scale utility customer
Both classes are valid buildout paths with distinct constraints. Retired-plant sites carry their own challenges (coal combustion residue liabilities, rural fiber, water rights re-permitting) and warrant separate analysis.
A wrinkle on the large end. Large petrochemical complexes deserve a note because the numbers scale differently. Their substations typically carry significant spare capacity above normal plant load, which enables a grid-extended variant of the same model: the AI factory runs primarily on grid power, with PV and BESS reserved for peak shaving and short backup rather than as the sole source. At this scale a single host can support 30–50 MW — roughly 150–250 Vera Rubin racks — dispatched against plant demand: when the plant is at peak the AI factory throttles back, when the plant runs light it runs full.
A reasonable pushback: are AI factories really dispatchable on that schedule? Inference workloads tolerate seconds-to-minutes cycling without GPU damage — throttling and power-gating don’t cause the kind of wear that dominates GPU service life. The wear item is the liquid cooling loop (pumps and seals prefer steady operation), and a few minutes of BESS ride-through smooths the short cycles so the cooling loop sees a flatter duty profile than the grid-facing load. Longer shifts on the order of hours or days are a scheduling problem, not a physical one.
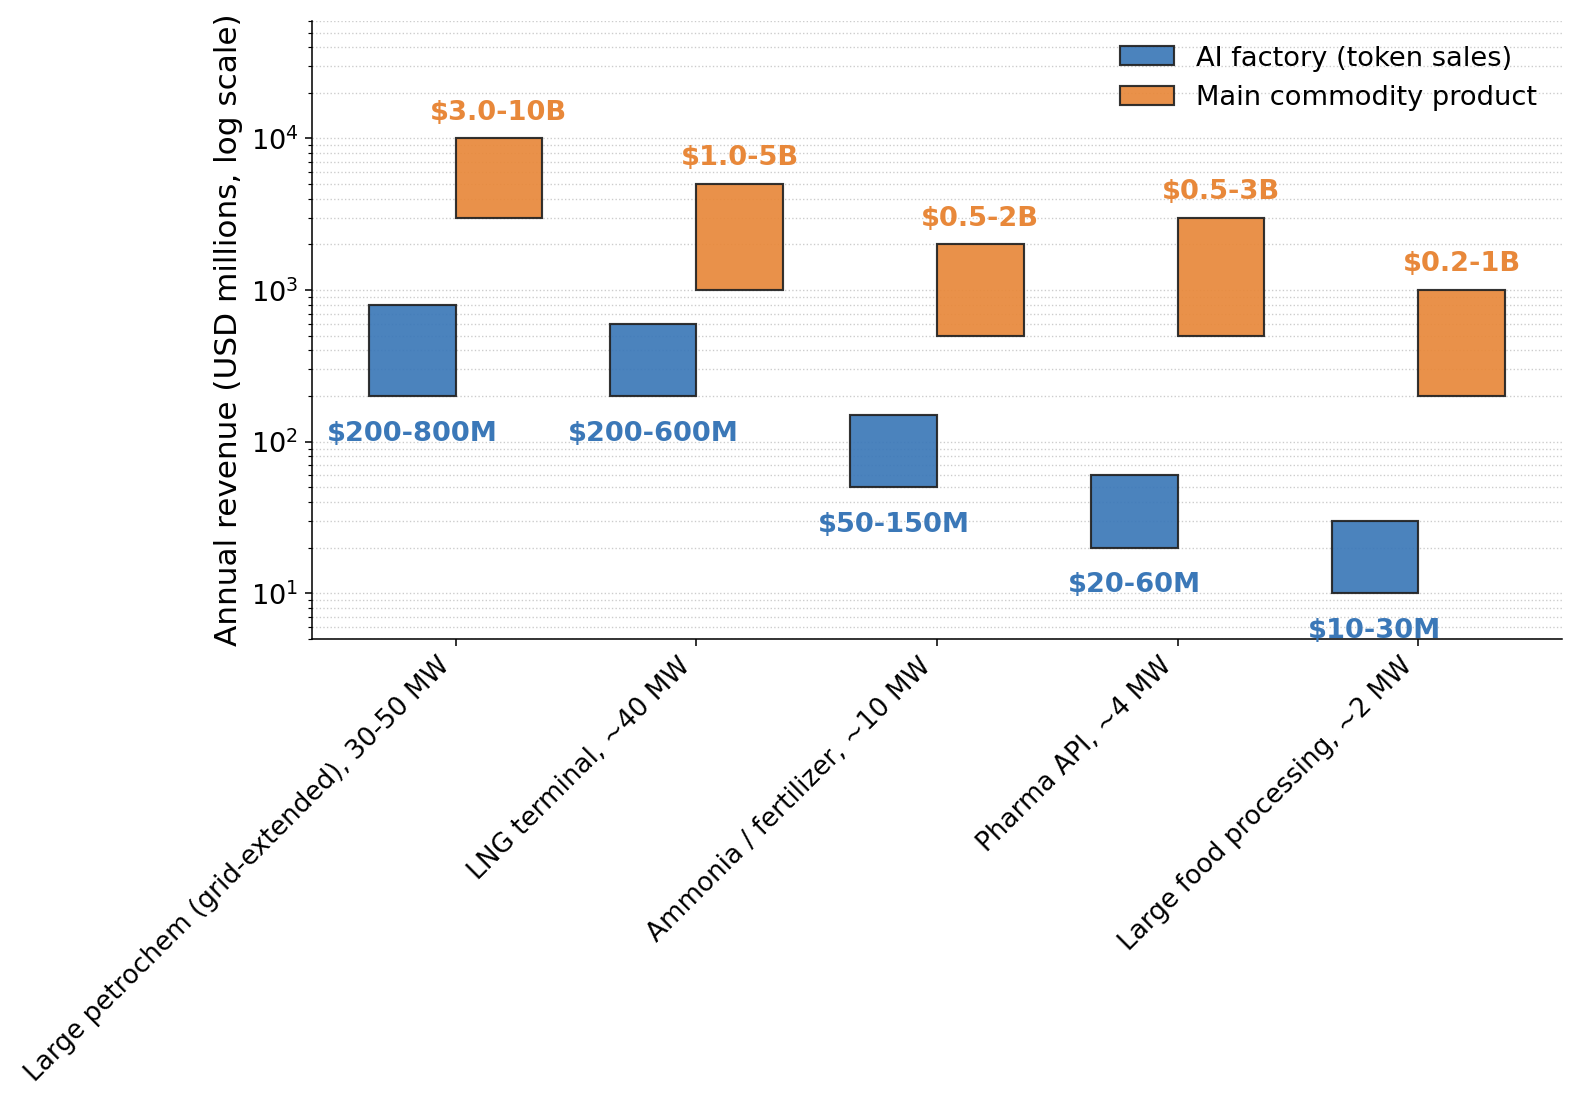
The implication is product flexibility. The host now earns from two uncorrelated cycles — its physical commodity and inference output. When commodity margins compress, the operator runs the AI factory harder; when they’re strong, the AI factory throttles down or sells spare capacity to a partner. For an industry prone to multi-year commodity cycles, that is a meaningful hedge. Figure 6 puts the rough annual revenue magnitudes side by side.
Figure 6. Annual revenue: AI factory (token sales) vs. main commodity at the same host site
Bars are low–high annual revenue ranges on a log scale. AI factory revenue assumes the site-matched rack count from Table 3 running at a price-per-token range consistent with current frontier-model inference pricing for enterprise workloads. Commodity revenue ranges reflect public annual-report disclosures and trade-press benchmarks for plants in the relevant size class. Both bands are moving targets: inference pricing has fallen roughly tenfold over the last twenty-four months, but per-rack throughput has risen at a similar rate as hardware generations and software optimizations (vLLM, FP4, speculative decoding) compound, so per-rack annual revenue has been more stable than the per-token price suggests. Where the five-year steady state lands is not knowable today; the durable observation here is the ranking between site types, not the absolute levels. (click image to enlarge)
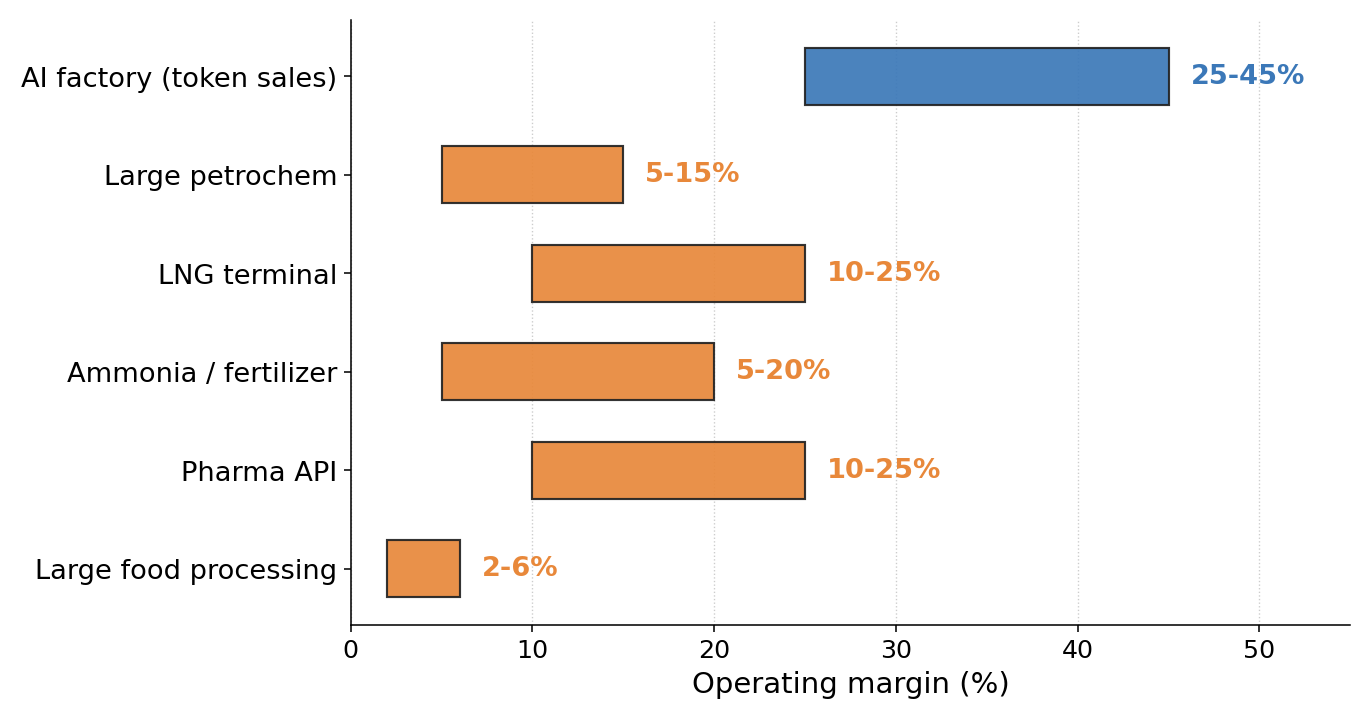
Figure 6 only shows revenue. At hosts like meatpacking the token stream looks small on top-line, but Figure 7 tells the other half of the story — on operating margin, token sales currently sit above every commodity host, so the contribution to site-level profit is larger than the revenue bars would suggest. Token margins will compress as inference commoditizes, but starting from the CoreWeave FY2024 band [20] the gap is wide enough that the token stream likely stays on the favorable side of the comparison at most hosts.
Figure 7. Typical operating margin: AI factory (token sales) vs. main commodity at each host
Token margin band anchored to CoreWeave FY2024 (gross margin ~74%, adjusted EBITDA margin ~58%, with reported net loss driven by depreciation and interest rather than weak operations), stepped down for mature-operator leverage and site-level overhead [20]. CoreWeave is a GPU-rental proxy — a pure token-sales AI factory has a different cost stack, and the FY2024 margin reflects the 2023–24 GPU supply-scarcity cycle peak rather than a steady state. Commodity margins are rough industry averages and swing with the commodity cycle. (click image to enlarge)
The numbers in Table 3 are order-of-magnitude estimates from public federal datasets; the match between those counts and actual buffer-zone viability at the specific site level is not audited here. What the analysis suggests is that the physical envelope holds up across the site types examined. Whether the regulatory and commercial pathway holds has to be answered one site at a time.
A few honest limits:
Not every site in these categories has usable land. Refineries often have residential development creep that compresses the effective buffer; some WWTPs sit on irregular parcels carved out of waterfront or floodplain. Site geometry matters.
Organizational friction is real. A chemical company’s EHS committee has never approved anything in the buffer zone. A municipal water district has never signed a ground lease for a modular AI factory. These are first-of-their-kind transactions.
Water and air quality vary by host. Plant water doesn’t feed directly into IT cooling — it’s coupled through a heat exchanger that keeps the IT coolant closed-loop and clean. At sites with sour-gas or ammonia exposure (refineries, fertilizer plants, WWTPs with anaerobic digestion), rack enclosures may also need enhanced air filtration. Both are routine building engineering; specific designs are out of scope here.
1.7 What comes next
The next blog will attempt a detailed look at one specific WWTP case — a ~30 MGD activated-sludge plant serving a city of roughly 300,000, the same archetype used in the §1.3 example — worked through with code and first-principles calculations, aiming to sharpen the cost and performance numbers and surface whatever surprises a more careful site-level model tends to produce.
A follow-on post will demonstrate a working inference layer on the same site: an LLM plus root-cause-analysis agent setup running alongside the plant’s operations, to see how the thing actually behaves once it is connected to real process data.
This is an idea, sketched at the first-principles level. Real deployments will run into site-specific constraints not captured here — grid studies, cooling details, HAZOP reviews, local permitting, ground lease structures. The goal of this series is to explore whether the overall direction holds up; the detailed engineering comes in the next blog. Feedback from operators, utility engineers, and AI infrastructure architects with hands-on experience is welcome.
Sources
[1]US EPA Risk Management Program rule (40 CFR Part 68), 2024 update. Regulates ~11,740 facilities across petroleum refineries, chemical manufacturers, water/wastewater treatment systems, chemical and petroleum wholesalers, food and beverage manufacturers with ammonia refrigeration, agricultural chemical distributors, and other RMP-regulated facilities. EPA, Safer Communities by Chemical Accident Prevention Rule (March 2024).
[2]NVIDIA Vera Rubin NVL72 platform specifications. 72 Rubin GPUs × 288 GB HBM4 per GPU = 20.7 TB HBM4 per rack; 3.6 EFLOPS NVFP4 inference per rack; NVLink 6 switch. NVIDIA press release and CES 2026 keynote.
[3]Vera Rubin NVL72 rack power specifications. Max Q: ~190 kW rack TDP; Max P: ~230 kW rack TDP. Source: Ming-Chi Kuo supply chain checks (Jan 2026); SemiAnalysis Vera Rubin BoM and Power Budget Model (Feb 2026).
[4]US chemical manufacturing establishments (NAICS 325). US Census Bureau County Business Patterns. RMP-triggering subset per EPA 2024.
[5]US petroleum refineries and large petrochemical complexes. 132 operable refineries as of January 2025. US EIA Refinery Capacity Report (June 2025). Large petrochemical complexes estimated at ~80 global-scale sites.
[6]US pharmaceutical API manufacturing sites. The US accounts for 8% of total global active API DMFs as of 2024, with ~150–250 US API manufacturing sites. US Pharmacopeia, Medicine Supply Map (Jan 2026).
[7]US ammonia/fertilizer production plants. 30 operating ammonia plants in the US as of 2023, with 9 new plants proposed and 3 expansions. Environmental Integrity Project, The Fertilizer Boom (2023).
[8]US food processing plants with anhydrous ammonia refrigeration. USDA FSIS inspects ~6,800 meat, poultry, and egg product plants; large HACCP-size subset combined with dairy, beverage, and cold storage with >10,000 lb NH3 inventory gives ~1,500 RMP-triggering sites. USDA FSIS MPI Directory (2024); EPA RMP Appendix E.
[9]US large refrigerated cold storage warehouses. “More than a thousand large cold storage warehouses spread across the country.” Center for Land Use Interpretation, Refrigerated Nation (updated 2024).
[10]US publicly-owned wastewater treatment plants (POTWs). 17,544 POTWs total as of 2022. EPA 2022 Clean Watersheds Needs Survey (2024 report to Congress); CRS Report R48565 (June 2025).
[11]US LNG facilities. 170+ LNG facilities operating in the US, including 8 operating export terminals. FERC LNG facility maps (accessed 2026).
[12]Cerebras WSE-3 / CS-3 system specifications. 4 trillion transistors, 900,000 AI cores, 44 GB on-chip SRAM, 21 PB/s on-chip memory bandwidth, 125 PFLOPS peak. Cerebras press release, Cerebras Systems Unveils World’s Fastest AI Chip (March 2024); IEEE Spectrum, Cerebras WSE-3: Third Generation Superchip for AI (March 2024).
[13]Utility distribution-level service upgrades for commercial customers. Timelines vary widely by utility, equipment availability, and whether upstream utility-side reinforcement is triggered. California CPUC energization framework (Rules 15/16, 2024) targets an average of ~182 calendar days with a maximum utility-controlled timeline of ~306–357 days for distribution service projects; Rule 21 Fast Track sets a 120 business day nominal for simpler interconnections. Custom commercial/industrial transformer procurement can run 12+ months in the current market. On running industrial sites, a separate dedicated feeder and transformer for a new load is usually preferred over swapping the main service transformer, because the outage and cutover risk to the operating plant outweighs the equipment cost; where the main service must be touched, the cutover is scheduled into a planned annual turnaround.
[14]US AI data center capacity under construction. Sightline Climate, 2026 Data Center Outlook (April 2026). Reports US AI data center capacity actually under active construction as ~5 GW for 2026 and ~6.3 GW for 2027, with an additional ~26 GW announced but not broken ground. Cited by Bloomberg and Tom’s Hardware. BloombergNEF Global Data Center Tracker corroborates ~17 GW of the ~23 GW global in-construction total as US-based (Sept 2025).
[15]Levelized cost of energy (LCOE) for utility-scale PV+BESS. Lazard, Levelized Cost of Energy+ (2024): utility-scale solar PV LCOE $24–36/MWh; solar + 4-hour battery storage combined LCOE $45–65/MWh. NREL Annual Technology Baseline 2025. Behind-the-meter deployment typically saves additional $10–15/MWh by avoiding transmission and distribution charges, though smaller-scale (1–20 MW) installations can offset this with higher per-MW capex.
[16]Military drone strikes on AWS data centers, March 1, 2026. First confirmed military attack on a hyperscale cloud provider. Two AWS sites were struck in the UAE and one in Bahrain, taking down two of three availability zones in AWS ME-CENTRAL-1 (UAE) and one in ME-SOUTH-1 (Bahrain). Outages affected Emirates NBD, First Abu Dhabi Bank, Snowflake, Careem, and others. Sources: Fortune (March 9, 2026); CNBC (March 3, 2026); Rest of World (March 2026); TechPolicy.Press (March 12, 2026).
[17]Jensen Huang on the inference share of AI compute. NVIDIA CEO, public statements at GTC 2025–2026 and subsequent investor interviews. Huang has said that inference already makes up more than 40% of NVIDIA’s data center revenue and will account for roughly 80% of long-term AI compute versus 20% for training, and that overall inference demand is “about to go up by a billion times” as AI is embedded into work and consumer applications. Cited in Bg2 Pod (Sep 2025); Yahoo Finance (Oct 2025); Dwarkesh Podcast (2025); BizTech Magazine coverage of GTC 2026 (March 2026).
[18]Andrew Feldman on AI inference as the dominant workload. Cerebras co-founder and CEO, public statements describing inference as “the dominant cost and performance bottleneck in AI.” TechArena fireside chat (2025); Bloomberg Tech Disruptors podcast (May 2025); CNBC interview (October 2025).
[19]WWTP electrical consumption benchmarks. Conventional activated sludge plants typically consume 1,000–1,500 kWh per million gallons treated; biological nutrient removal and tertiary treatment plants rise to 1,500–2,500 kWh/MG. Empirical per-plant data: DC Water Blue Plains (370 MGD, ~25 MW) and NYC Newtown Creek (310 MGD, ~22 MW) both measure ~68–71 kW/MGD, which scales to ~2.0–2.1 MW at 30 MGD. Sources: EPRI Energy Index Development for Benchmarking Water and Wastewater Utilities (2013); EPA Clean Watersheds Needs Survey (2022/2024); utility-published electrical service ratings for the named plants.
[20]CoreWeave FY2024 financial disclosures. Reported revenue ~$1.9 B with gross margin ~74% and adjusted EBITDA margin ~58%; reported net loss driven primarily by depreciation and amortization on a rapidly built-out GPU fleet and by interest expense on infrastructure debt, rather than by an operating shortfall. Used here as the only pure-play GPU-rental public financial reference at the time of writing. CoreWeave Form S-1 (March 2025); CoreWeave Q4 2024 and FY2024 earnings release (March 2025).